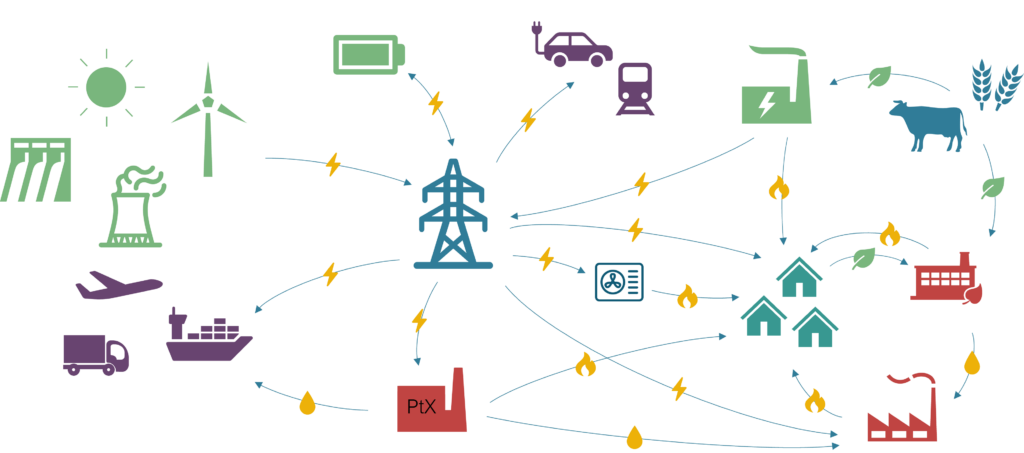
Energy system models and tools described below are examples of models and tools that we use and/or have developed.
We are experts in using the TIMES energy system model and other models such as the heat and power model Balmorel. We develop customized TIMES models on country, regional, city, district, factory, and building levels.
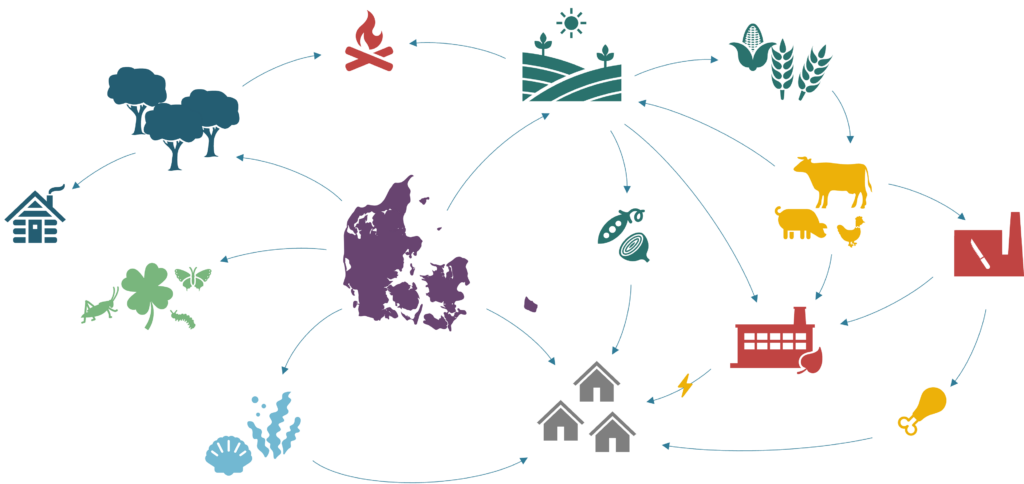
Furthermore, we have developed the Danish Bioresource model (DK-BioRes) which compiles data on all biomass resources available in Denmark’s agriculture, aquaculture, and forestry sectors.
When relevant, we use tools such as CGE modelling, Spreadsheet models, Land-use, and air pollution health impact analysis. We have developed a special tool for dividing global CO2 between countries, the carbon budget tool, and for studying tradeoffs between economic and technical development, IPAT(D).
The TIMES model framework
The TIMES model is internationally recognized and developed under the Energy Technology Systems Analysis Program (ETSAP). ETSAP is one of the longest-running technology collaboration programs under the International Energy Agency (IEA). ETSAP currently has 21 countries as contracting parties and one private sector sponsor.
The IEA-ETSAP community leads a major initiative for open-source solutions for energy scenario modelling needs. The staff of the Energy Modelling Lab is actively involved in the ETSAP Community. We participate in international collaboration on continuously improving the TIMES model and are committed to documenting innovations and sharing knowledge.
Top-down and bottom-up
We use the model in two ways. In the top-down approach, the model designates the optimal path to a certain target. A target could be net zero emissions in 2050 at the country level. In the bottom-up approach, the model can test the impact of new policies such as a CO2 tax or the phasing out of biomass.
Customized and updated TIMES Models
city, district, and entity models

ENERGY ISLAND
We have crafted a model of an energy island using the TIMES modelling framework, allowing us to generate scenarios and explore how to plan for the maximum economic returns for investors and developers.

GREATER COPENHAGEN
The TIMES-Varmelast model is solved on an hourly level (8760 hours). We equipped it with a detailed representation of the greater Copenhagen district heating area. The model features 98 regions representing relevant district heating supply, transmission, and demand areas.

GOTHENBURG
The TIMES-NE city model represents a Northern European city setting and has a representation of developments in the supply and demand side of the heating, electricity, and transportation sectors.

ARLINGTON
The TIMES-Arlington model represents a school’s heating and cooling systems and an adjacent neighborhood in Arlington, Massachusetts.

TROLLHÄTTAN
The TIMES-TE model has a representation of existing district heating operations and available energy resources, including not yet exploited sources such as wastewater.
country models

AZERBAIJAN
The TIMES-AZ model supports the development of low-carbon solutions, resulting in a Roadmap recommending relevant policies and technologies.

JORDAN
TIMES-Jordan was developed to support the National Long-Term Low Emission Strategy and Options Report 2050.

DENMARK
TIMES-DK has been used to analyze the future of district heating, evaluate the health impact of the green transition, and test the climate policies of all Danish political parties.

VIETNAM
The Vietnamese government uses TIMES-VNM to develop and implement a long-term energy strategy to reach net-zero emissions by 2050.
Regional models
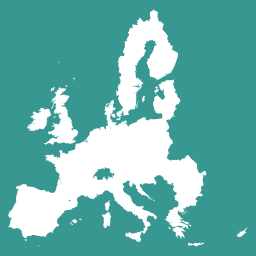
NORTHERN EUROPE
We have created TIMES-NEU covering Denmark, Norway, Sweden, Germany, Poland, Belgium, the Netherlands, and the United Kingdom. The model has been used in projects such as Analysis of Future Energy Markets and Best Locations of PtX Plants.
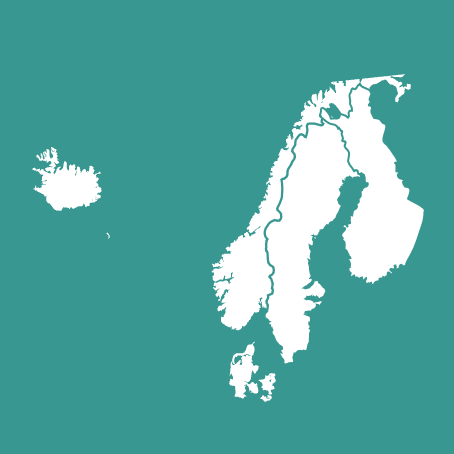
NORDIC COUNTRIES
The ON-TIMES (Open Nordics) covers Norway, Sweden, Denmark, Finland and Iceland. It has been used to identify the optimal pathways to a carbon-neutral future. It is also used to investigate possibilities for clean shipping.
All projects using TIMES-models »
The Danish Bioresource model (DK-BioRes)
The DK-BioRes model is flow-based and contains all Danish biomass resources from agriculture, forestry, and aquaculture. The model features several mitigation technologies for reducing carbon emissions and nitrification.
The bioresource model can be used to evaluate the consequences of different political means. The model has options for adjusting parameters such as the area distribution or animal production. Subsequently, the model will show the consequences for climate and the available biomass.
The model can generate scenarios of the impact of different strategies and of setting various targets. Likewise, it can trace the impacts of increasing the use of technologies such as manure acidification and air cleaning to reduce carbon emissions.
The DK-BioRes model has been used to generate scenarios for Denmark’s Climate Targets 2050 (the Danish Climate Council, 2024) and the report The Importance of Agriculture for Future Land Use (Jordbrugets Betydning for Fremtidens Arealanvendelse), (CONCITO, 2024
The model is available GitHub .
MODELLING DANISH AGRICULTURE
The model is built as part of a project for the Danish Energy Agency.
CLIMATE NEUTRAL AGRIGULTURE
The model has been used in a study showing two paths to a climate-neutral agriculture and forestry sector in Denmark.
Balmorel
Balmorel is a flexible power and district heating model. The model can cover any region or country. It’s used for detailed analysis within the power system and applies for long and short-term analysis.
The model was originally developed to model the region around the Baltic Sea but has been applied throughout the world.
Carbon budget tool
The carbon budget tool can be used to divide the remaining global CO2 budget as stated in the IPCC reports. Different parameters can be used as weights like population, GDP, and emissions.
IPAT(D)
IPAT(D) is meant to give an illustrative visualization of the impact of population size, affluence, and technological development on climate and Ecological Footprint.

